Your participation...counts!
Measurement results and statistical data
Measurement results are available in three different formats. The user may consult them and store them locally:
- With the statistical data projected on a map of Greece.
- As graphs relating to time.
- As a simple list with the details of each measurement.
Map
The statistical map is the main way of displaying the results of the measurements statistical analysis by region. Registered users can see on the map the measurements conducted in their region. Otherwise, when first pulled up the map shows the whole of Greece. Depending on zoom level, the numerical data is grouped by broader or narrower region. Specifically, resolution levels on an ascending scale range from administrative regions and regional units to municipalities and neighborhoods (based on postcodes).


The polygons lie symmetrically around the centre of the region they represent. The colours represent the range of values within which the result of the measurement falls for that specific region. Clicking on a polygon produces a pop-up showing the average value for the metrics of the tool selected. The following metrics are projected on the map for the NDT tool:
For the NDT values are shown for the following qualitative features:
- Download speed (downstream)
- Upload speed (upstream)
- Round Trip Time (RTT)
- Packet loss
- Jitter
The range of values for each of the indicators can be split into various intervals, as indicated in the note below the map. The colour of the corresponding polygon is determined by the interval to which each statistical value belongs.
The available options, such as upload and download speed, are shown in tabs above the map. By clicking on one of the polygons on the map, a pop-up appears, showing the mean value of all the metrics for the selected tool for that area.
All the connections in the area from all providers (ISPs) are taken into account when calculating the values.
Google Maps API was used to create the map, hence as with any application of this type, the mouse can be used to zoom and shift the map. The visitor can use the mouse and/or the zoom control slider to do this. He may also select from the various map layers in the top-right hand corner.
At higher resolutions, measurements are grouped into collated statistics by connection rather than by region. Besides the metrics measured, each pop-up also includes indications regarding:
- The nominal speed of the packet purchased by the user.
- Number of measurements conducted.

Graphs
HYPERION keeps record of measurements, in condition that users are registered with the system. These measurements are used to export statistical data, while the user has also the possibility, via the available graphs, to view the records of the performed measurements.
Measurements results are presented as a function of time, on a daily basis. In case that multiple measurements have occurred per day, then the average value is calculated.

List of measurements
The details regarding the user’s current measurement are displayed once it has been completed by the chosen tool. The user’s record, however, which contains all previous recorded measurements, can be called up by clicking on the Details tab.
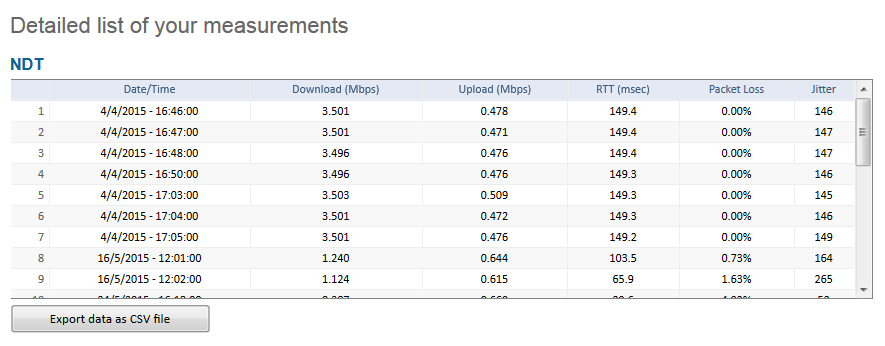 Each measurement is characterised by the date and time at which it was conducted. This is only recorded for users registered with the system. The Export data as CSV file tab allows this data to be recorded locally. The file can be opened using a spreadsheet application (e.g. Microsoft Office Excel).